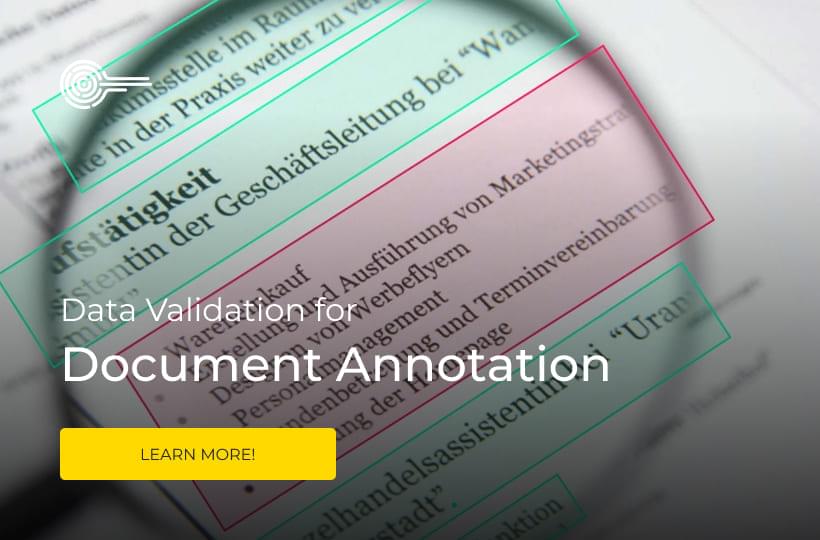
Building Annotation Performance Dashboards for Continuous Improvement

Creating annotation performance dashboards for continuous improvement involves building a system that tracks, analyzes, and visualizes the quality and effectiveness of data annotations over time. These dashboards help teams understand annotation accuracy, consistency, speed, and areas for improvement.
For visualization, a dashboard should present clear, interactive charts highlighting trends and anomalies. Common visual elements include line graphs to track accuracy over time, bar charts to compare annotator performance, and heat maps to identify common labeling errors.
Integrating machine learning models into the dashboard can improve automation. Models can detect systematic errors, recommend corrections, or even assist annotators with auto-suggestions, reducing repetitive work.
Key Takeaways
- Annotation accuracy directly impacts AI model performance.
- Modern dashboards offer real-time insights into key annotation metrics.
- Advanced time-tracking features, like the green dot indicator, optimize labeling efficiency.
- Centralized monitoring of labeling, review, and rework times enhances process optimization.
- High-quality training data is critical for achieving AI success.
Understanding the Fundamentals of Annotation Performance Dashboards
At the heart of the annotation performance dashboard are key performance indicators (KPIs) that help measure individual and team performance. Accuracy is a fundamental metric often measured by comparing annotations to a baseline set of accurate data or through inter-annotator agreement, which assesses the consistency between multiple annotators. Performance metrics track the speed of annotation, such as the number of labels created per hour or day, helping to identify bottlenecks or inefficiencies. Error rates highlight common mistakes, while coverage metrics ensure all necessary data points are labeled without gaps.
Another important aspect is data collection. Annotation tools generate logs, timestamps, and error reports that go to a dashboard for real-time or periodic analysis. Pre-processing these raw data points involves aggregating performance statistics, normalizing metrics across different annotators, and filtering out anomalies that can skew the statistics.
A dashboard should display metrics and provide actionable insights for continuous improvement. A drop in the accuracy of annotations can lead to unclear instructions that require clarification or additional training. A decrease in speed can indicate inefficiencies in the workflow, prompting process adjustments.

The Role of Quality Training Data and Accurate Annotation
Training data serves as the basis for learning a model, and the annotations' accuracy directly affects the model's performance. Poorly annotated data can generate noise, leading to unreliable predictions, while high-quality, consistently annotated data improves model generalization and reliability.
Accurate annotation ensures that the model learns meaningful patterns instead of detecting inconsistencies or biases in the data. For example, in an image classification task, if one annotator labels an object as a "cat" and another labels a similar object as a "dog", the model may have difficulty distinguishing between the two categories. Inconsistent annotations can confuse signals, reducing the model's ability to work effectively with unseen data. Establishing clear guidelines and consistently training annotators to follow them is crucial to avoid such discrepancies.
Agreement between annotators is another key aspect of good-quality training data. When multiple annotators annotate the same dataset, the level of agreement measures the consistency of the annotations. A low level of agreement may indicate subjective or unclear labeling criteria, which requires clarification in the annotation guidelines or further training of annotators.
The quality of the training data also depends on the diversity and representativeness of the data set. A model trained on a limited or unbalanced dataset may perform well on certain data distributions but fail in real-world scenarios where invisible variations occur.
Automation can be integrated into the process to further improve the accuracy of annotations. Semi-supervised learning and active learning approaches allow models to assist annotators by suggesting labels or highlighting uncertain samples that need to be reviewed manually.
Key Metrics: Throughput, Efficiency, and Quality
- Throughput refers to the number of annotations completed in a given time, such as the number of labels created per hour, per annotator, or per day. A high-throughput indicates a fast annotation process, but it must be balanced with quality to avoid rushed or inaccurate labeling. Measuring throughput helps teams assess performance, optimize resource allocation, and identify bottlenecks in the annotation pipeline.
- Efficiency focuses on how effectively annotators use their time and resources to produce high-quality annotations. This metric considers annotation speed, time spent on a label, and the required corrections. Annotations that require frequent review or manual corrections may indicate an inefficient workflow. Improving efficiency often involves improving annotation guidelines, automating repetitive tasks, and providing better training for annotators.
- Quality measures the accuracy and consistency of annotations, ensuring that the tagged data meets the required standards. It is often assessed using inter-annotator agreement (IAA), precision and recall (for object detection or classification), and error rates. High-quality annotations are essential for training reliable machine learning models, as incorrect or inconsistent labels create noise that can degrade model performance.
Optimizing Workflow with Annotation Performance Dashboards
Optimizing workflow with annotation productivity dashboards involves using data-driven insights to improve the annotation process's efficiency, accuracy, and overall effectiveness. These dashboards provide real-time monitoring, allowing teams to track key metrics such as annotation speed, accuracy, error rate, and agreement between annotators.
- One of the main ways that dashboards help optimize workflow is by identifying inefficiencies in annotation speed. If an annotator consistently lags behind others, additional training, better annotation tools, and more explicit instructions are needed. Dashboards can also show if specific annotations take longer than others, helping teams adjust task assignments to improve efficiency.
- Another key function of performance dashboards is quality monitoring. If accuracy drops after new instructions are introduced, it may indicate that the instructions are ambiguous. Dashboards can also highlight systematic biases in annotations, such as one annotator consistently labeling a category differently than others. Implementation of targeted quality control measures, such as consensus labeling, peer review, or automated validation checks, ensures the high reliability of annotations.
- Automatic notifications and feedback mechanisms on dashboards further simplify workflow optimization. For example, if the annotator's accuracy falls below a certain threshold, the dashboard can trigger an alert, prompting a review or re-training. Similarly, if the annotation speed suddenly decreases, it may indicate technical issues, fatigue, or complex data instances that require additional refinement.
- Advanced dashboards also integrate machine learning annotations, where models suggest labels or flag uncertain cases for human review. AI-powered workflows improve speed and quality by reducing repetitive work and focusing human effort on complex cases.
Managing Active Labeling Time and Reducing Idle Periods
- Prioritize tasks: Ensure that annotators always have tasks ready to go, which is crucial for reducing downtime. By grouping tasks or using a real-time task assignment system, annotators can seamlessly transition from one task to another, avoiding waiting periods. This system also allows managers to distribute tasks based on complexity or priority, helping to balance the workload within the team. Alternating tasks is another helpful strategy for preventing monotony by ensuring annotators stay engaged and refreshed.
- Clear guidelines: Clearly defined annotation guidelines are essential to reduce confusion and ensure consistent, accurate labeling. Ambiguous instructions can cause annotators to stop and seek clarification, resulting in unnecessary downtime. Comprehensive training sessions and regular calibration ensure that all annotators have the same understanding of the instructions. By using examples and providing clear edge cases, teams can help annotators feel more confident in their decisions.
- Automation: Using automation tools can significantly reduce the manual workload, allowing annotators to focus on more complex tasks. AI-powered pre-labeling can offer suggestions or even complete specific simple annotations, speeding up the process and reducing the need for human intervention. Automated error-checking systems can detect common mistakes in advance, preventing lengthy revisions later. Additionally, machine learning models can be trained to identify areas where annotators struggle, highlighting potential data points needing additional attention.
- Real-time monitoring: Performance dashboards allow managers to track annotator performance and instantly identify periods of downtime. Dashboards can display metrics such as annotation speed, error rate, and task completion time, offering a clear view of the team's performance. By setting up alerts or notifications, managers can be immediately informed if an annotator takes longer than usual to complete a task or is not used for too long.
- Gamification/Incentives: Incorporating gamification into the annotation process can increase engagement and motivation among annotators. By rewarding high performance with points, badges, or leaderboard rankings, teams can foster a sense of competition and achievement. Not only does this help reduce downtime, but it also encourages annotators to improve their speed and accuracy. Setting performance benchmarks, such as completing a certain number of annotations with high precision, can provide realistic goals for annotators to strive for. In addition, incentives can create a positive, collaborative environment where annotators feel valued for their contributions and motivated to maintain high standards.
Exploring Advanced Analytics and Performance Metrics
- Predictive analytics uses historical data to predict future performance trends and potential bottlenecks. By analyzing past annotation data, machine learning models can predict which annotators might slow down, which tasks will take longer than expected, and when the quality of annotations might decline. This allows teams to proactively allocate resources, adjust task assignments, or take preventive measures before problems arise. For example, if annotating a specific type of data is taking longer due to its complexity, additional resources or automation tools can be deployed in advance to handle the increased workload.
- Instead of relying solely on fundamental metrics such as overall accuracy or speed, advanced analytics provides a detailed view of performance. Metrics can be categorized by task type, category, or individual annotator. For example, by tracking the time spent on certain types of annotations (e.g., image segmentation or object classification), managers can identify tasks that are inherently more time-consuming or error-prone. This level of granularity helps identify specific areas for training or tool enhancements, for example, if particular categories consistently have lower accuracy due to complex labeling rules or ambiguous data.
- Inter-annotator agreement (IAA) is a standard metric used to measure the agreement between annotators. However, advanced analytics can go deeper by calculating the level of agreement and analyzing disagreement patterns. This helps identify areas where the guidelines may be unclear or where further training or clarification is needed. Additionally, analyzing discrepancy trends over time can help track whether new instructions or process modifications lead to improvements or increased confusion.
- With advanced analytics, annotators can receive real-time feedback based on their current performance. For example, if an annotator's error rate exceeds a certain threshold, the system can alert them to review their most recent annotations. More advanced systems can even suggest corrective actions, such as pointing out common errors or offering examples of corrections. This feedback loop helps maintain high-quality annotations, and the system dynamically adapts to workflow or annotator performance changes, ensuring real-time performance and accuracy optimization.
- Advanced analytics tools can track the provenance of annotations, meaning they can record the history of each data point from the time it is tagged to any revisions it undergoes. This traceability provides valuable insight into how data changes over time and who contributed to it. If there is a problem with a particular annotation (e.g., it leads to an error in model predictions), teams can track the original label and understand whether the problem was caused by individual performance, ambiguity in the guidelines, or other factors. This detailed level of tracking improves accountability, helps identify errors, and allows for better control over data quality.
Summary
Dashboards provide detailed insights into performance by task type, annotator, and category, helping to identify inefficiencies and areas for improvement. Predictive analytics and trend analysis help teams proactively address potential slowdowns or quality issues, while real-time feedback supports continuous improvement and ensures annotators adjust their performance quickly.
Quality control is a core component of effective performance dashboards. By analyzing the agreement between annotators and detecting errors, dashboards help maintain high quality annotations, ensuring that the annotated data is reliable for training machine learning models.
In addition to tracking performance, dashboards also provide transparency to stakeholders, enabling managers to make informed decisions about resource allocation and process optimization. By identifying bottlenecks, quality issues, and resource imbalances, dashboards help teams make targeted improvements, increase cost efficiency, and reduce downtime.
FAQ
What metrics are most important to track in an annotation performance dashboard?
Throughput, efficiency, and quality. These metrics offer insights into how quickly tasks are completed, the quality of work, and opportunities to reduce downtime.
How do these dashboards integrate with our existing data sources?
They can connect with various platforms and tools, consolidating data into a single interface for a holistic view of your annotation processes and overall project health.
What customization options are available for the dashboard?
Dashboards can be tailored to display specific metrics, datasets, and visualizations, ensuring they align with your team's unique needs and goals.
What steps can we take to reduce idle time in our annotation workflows?
Analyze idle time metrics to identify patterns, then adjust task distribution or provide additional training to keep your team engaged and productive.